Examples - Visualization
A picture says more than a thousand words. This is even more so true for statistics. Visualizing results, generating plots from data is an integral part of ADAMS. Check out what ADAMS can do in the visual department.
Note: the videos should only be considered educational, as some of the concepts in ADAMS have changed over time. E.g., global actors are now called callable, since they can appear in different scopes within the flow. Also, SingleFileSupplier and MultiFileSupplier got merged into the FileSupplier actor.
Learning curve for a WEKA classifier
Generates and visualizes a learning curve for J48, a non-incremental WEKA classifier. The classifier gets trained every 25 instances and evaluated against test set and Accuracy, RMSE and AUC gets plotted in one plot.
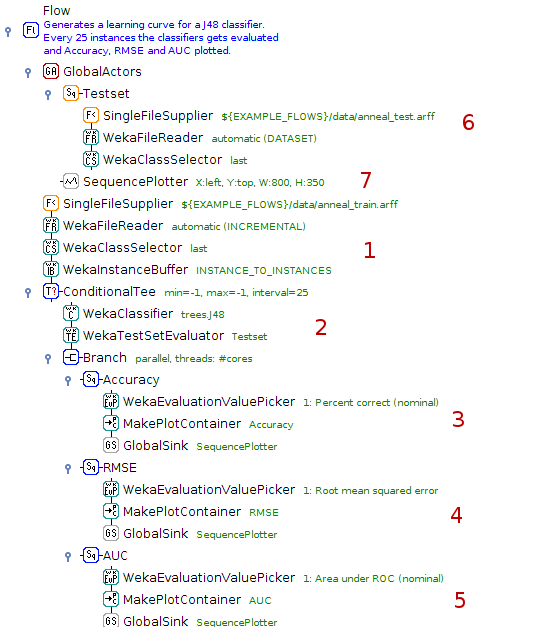
Read in dataset incrementally and buffer incoming data
Every 25 instances, build classifier and evaluate against test set (defined as global actor, see 6)
Obtain accuracy and create a plot container for Accuracy plot sequence
Get root mean squared error and turn it into a plot container as well, this time for the RMSE sequence
Retrieve AUC (area under curve) statistics and generate plot container for AUC sequence.
Sequence of actors for reading in a test set
The plot for all three statistics
Visualization of seismic data
Seismic data was retrieved using the Geonet client.
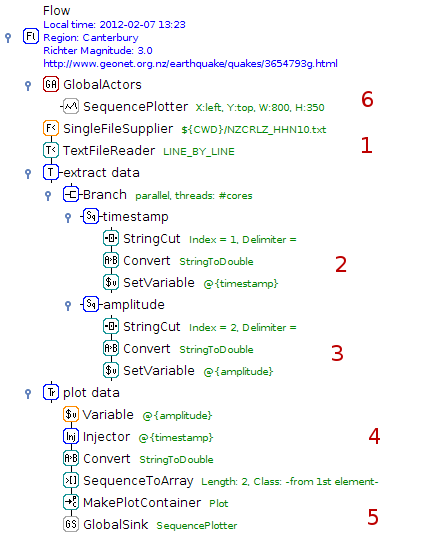
Read text file, line by line
Extract Unix timestamp, convert into double and store as variable
Extract amplitude, convert into double and store as variable
Turn timestamp and amplitude into a double array
Generate data structure for plot
The global plot
Email alerts for seismic events
Seismic data was retrieved using the Geonet client. Apart from visualizing the data, this flow also sends out an email alert if a tremor exceeds a certain strength.
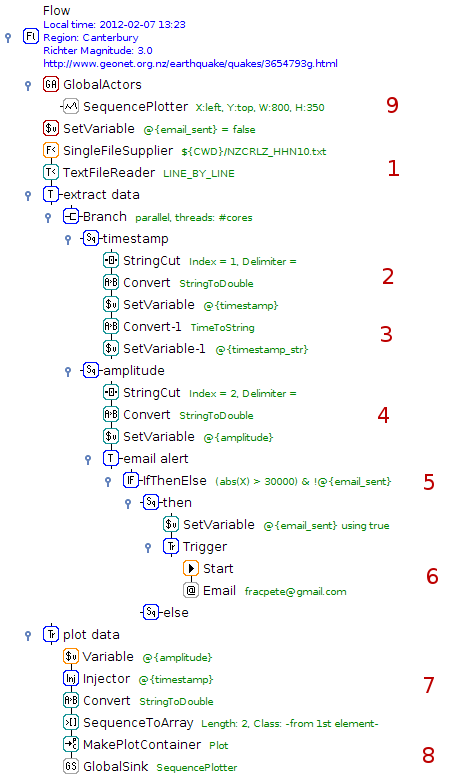
Read text file, line by line
Extract Unix timestamp, convert into double and store as variable
Convert timestamp into human-readable representation for email
Extract amplitude, convert into double and store as variable
Check whether incoming token (amplitude) is larger than threshold and email hasn't been sent yet
Note that email was sent and send email with information about event (time/date and amplitude)
Turn timestamp and amplitude into a double array
Generate data structure for plot
The global plot
LEIA - visualizing bridge sensor data
Visualizing sensor data of the InfraWatch project using the LEIA/ADAMS framework:
Bridge vibration
Illustration of sensor data processing with the ADAMS/LEIA workflow engine.
Vehicle detection
Demonstration of the ADAMS/LEIA workflow engine on traffic sensor data.
Publication
Knobbe, A., Blockeel, H., Koopman, A., Calders, T., Obladen, B., Bosma, C., Galenkamp, H., Koenders, E., and Kok, J.: InfraWatch: Data Management of Large Systems for Monitoring Infrastructural Performance. IDA Proceedings (2010). [pdf]